Client survey
Category
Information visualizationAbout This Project
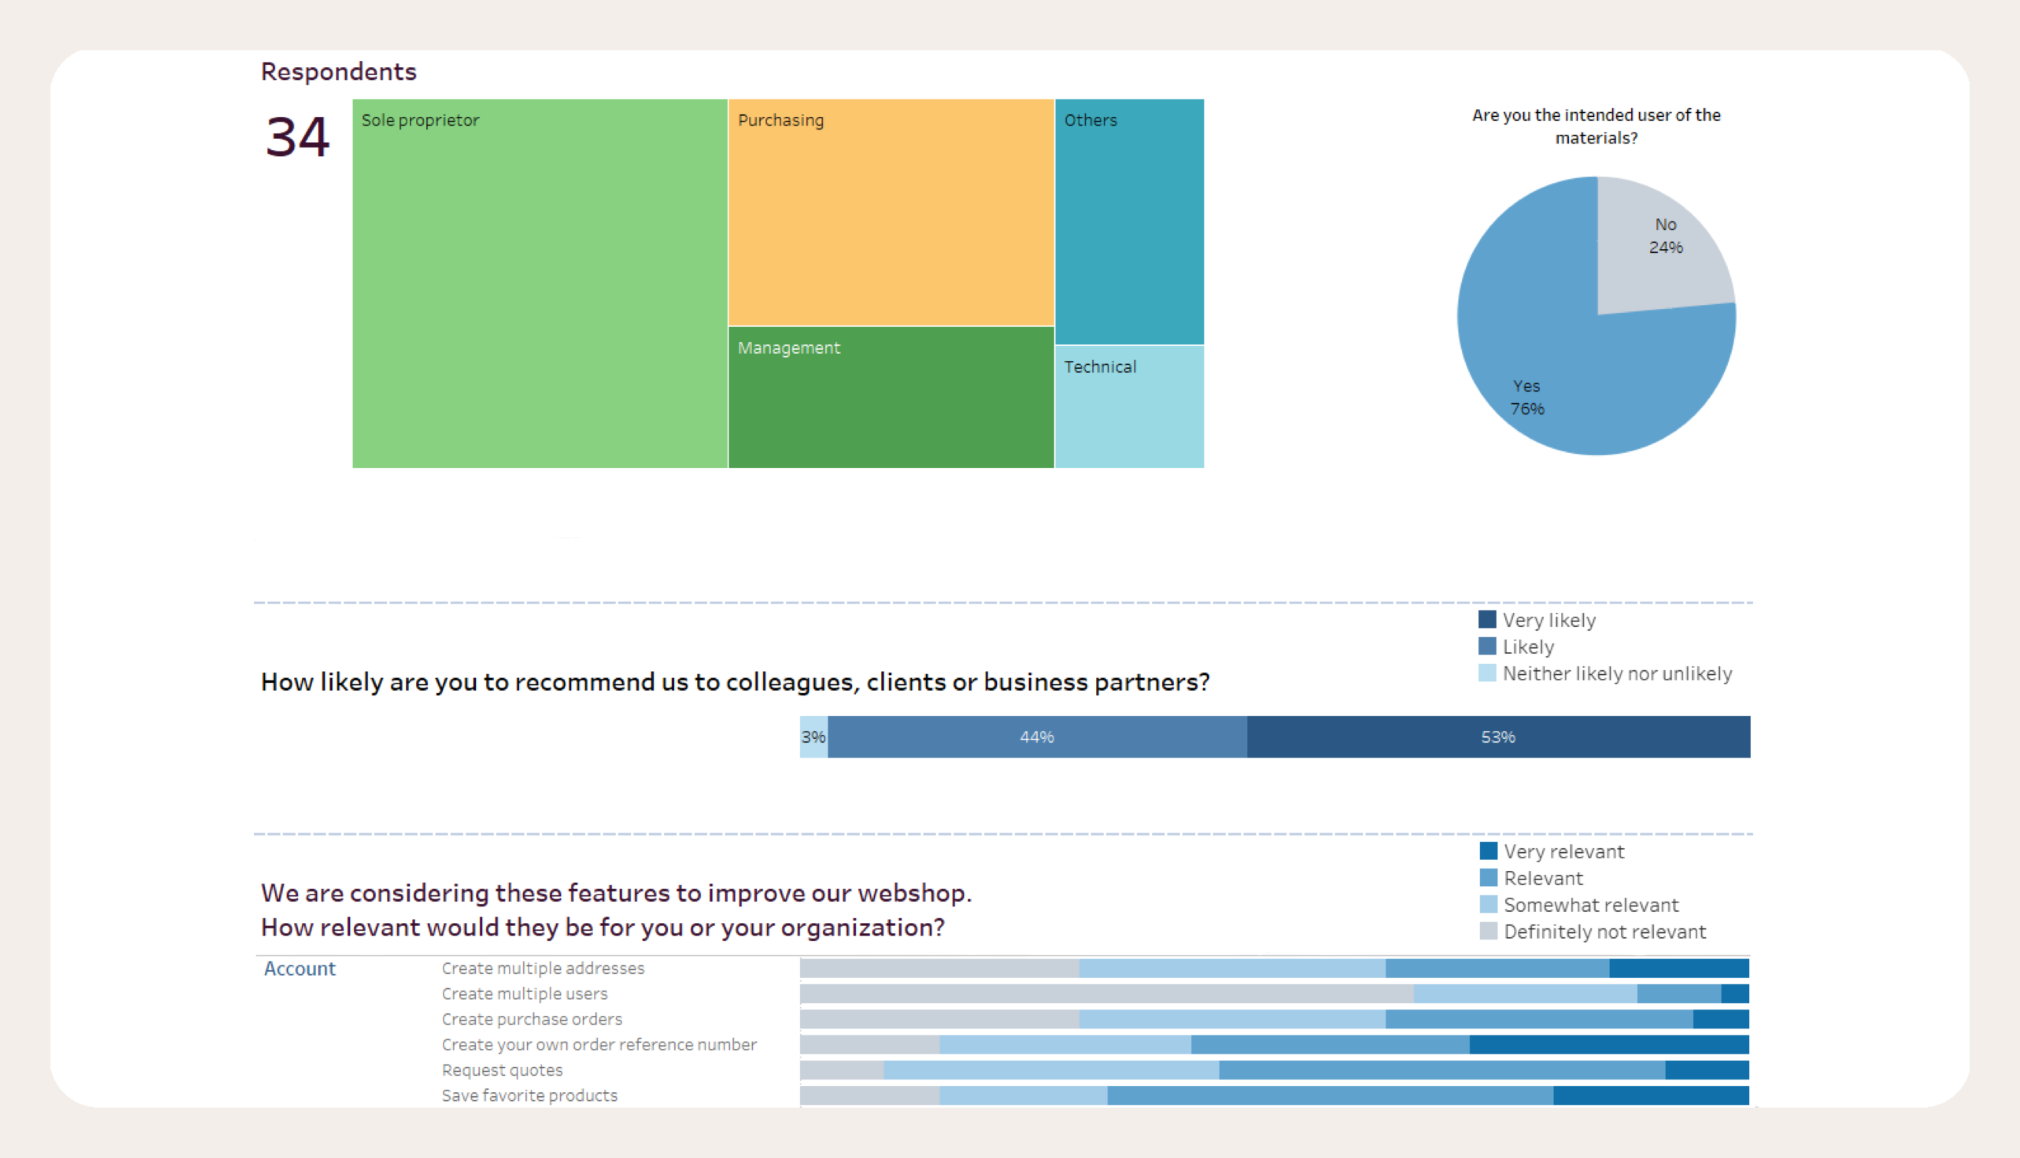
When you conduct a survey among your customers, you need clear dashboards to view and understand the results.
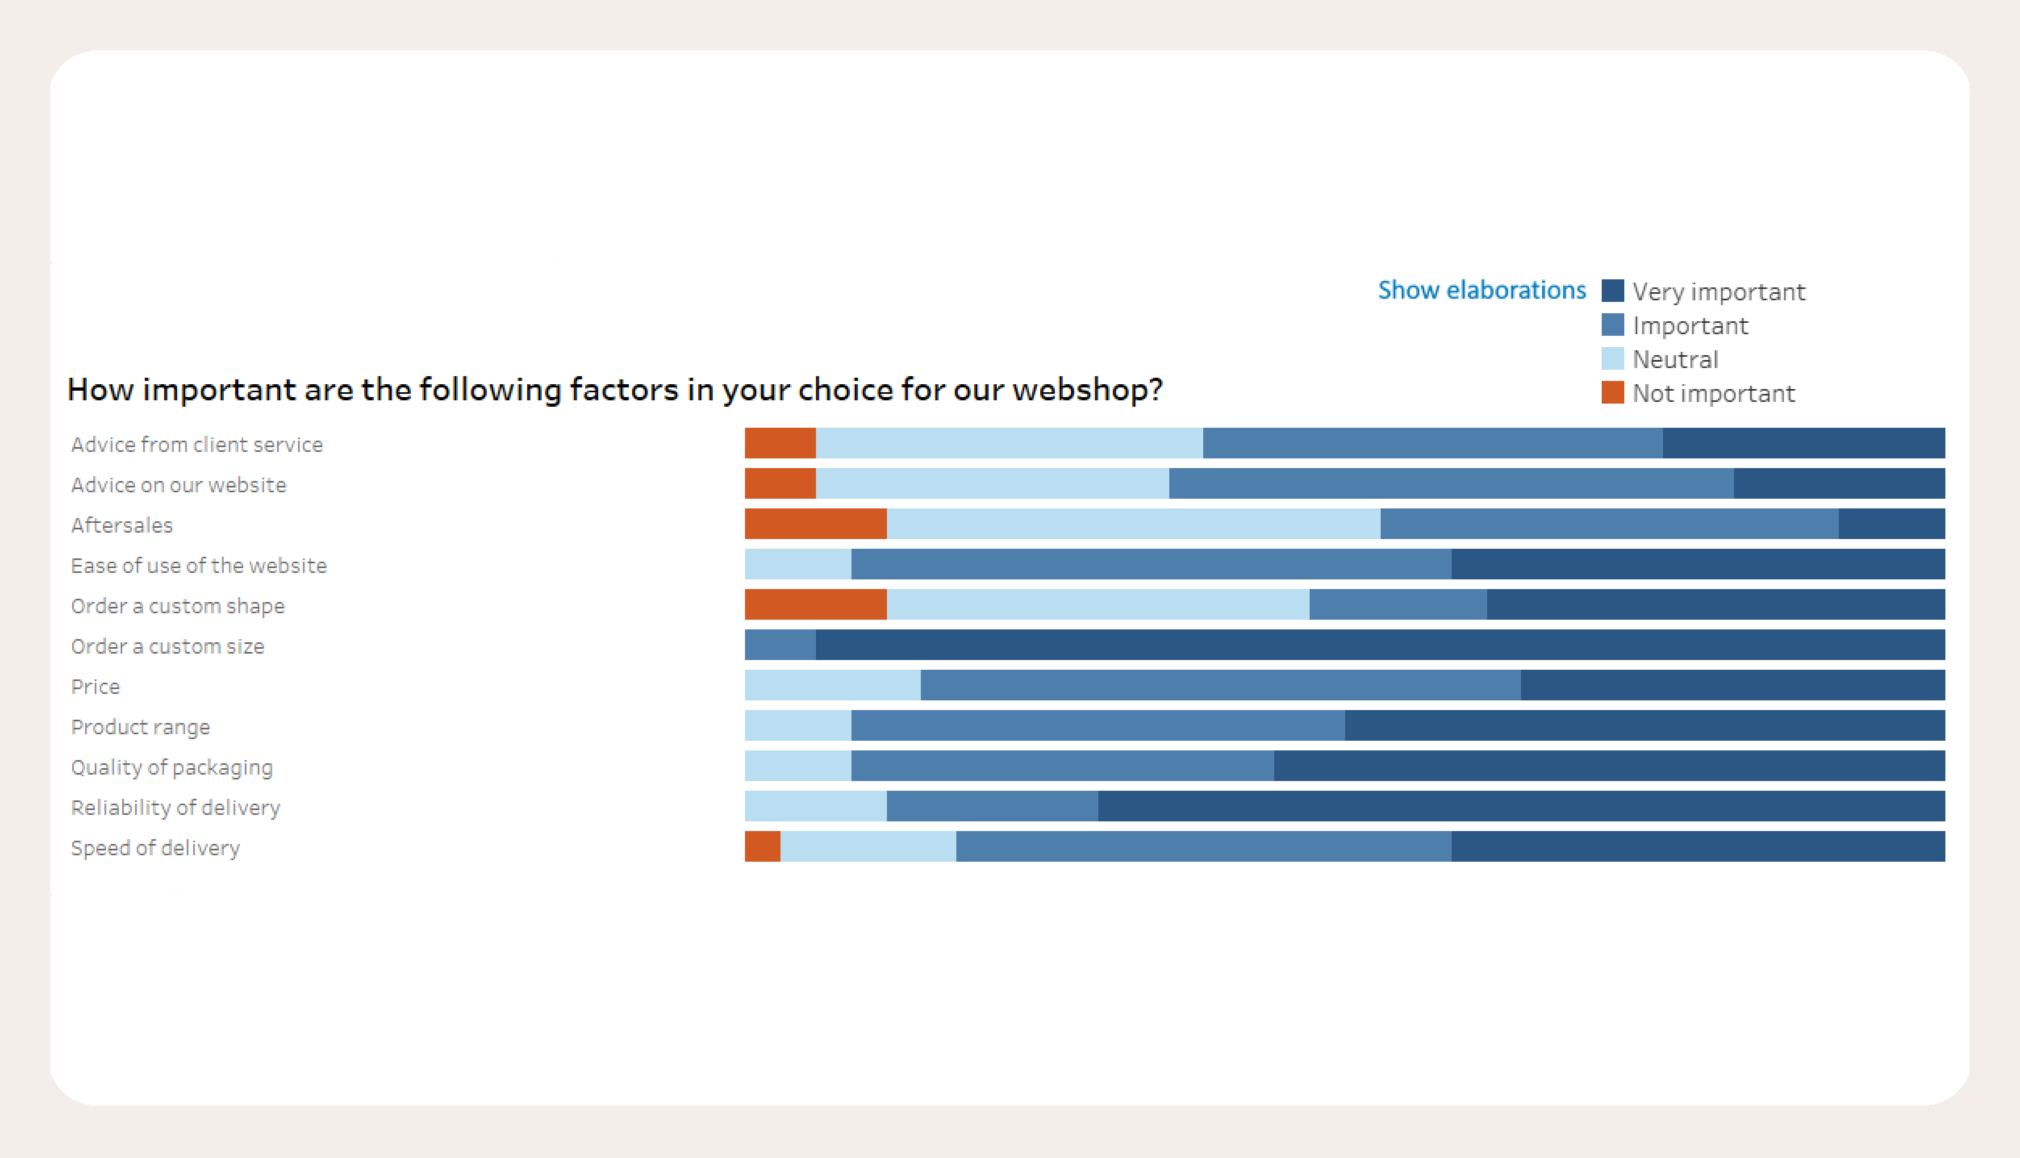
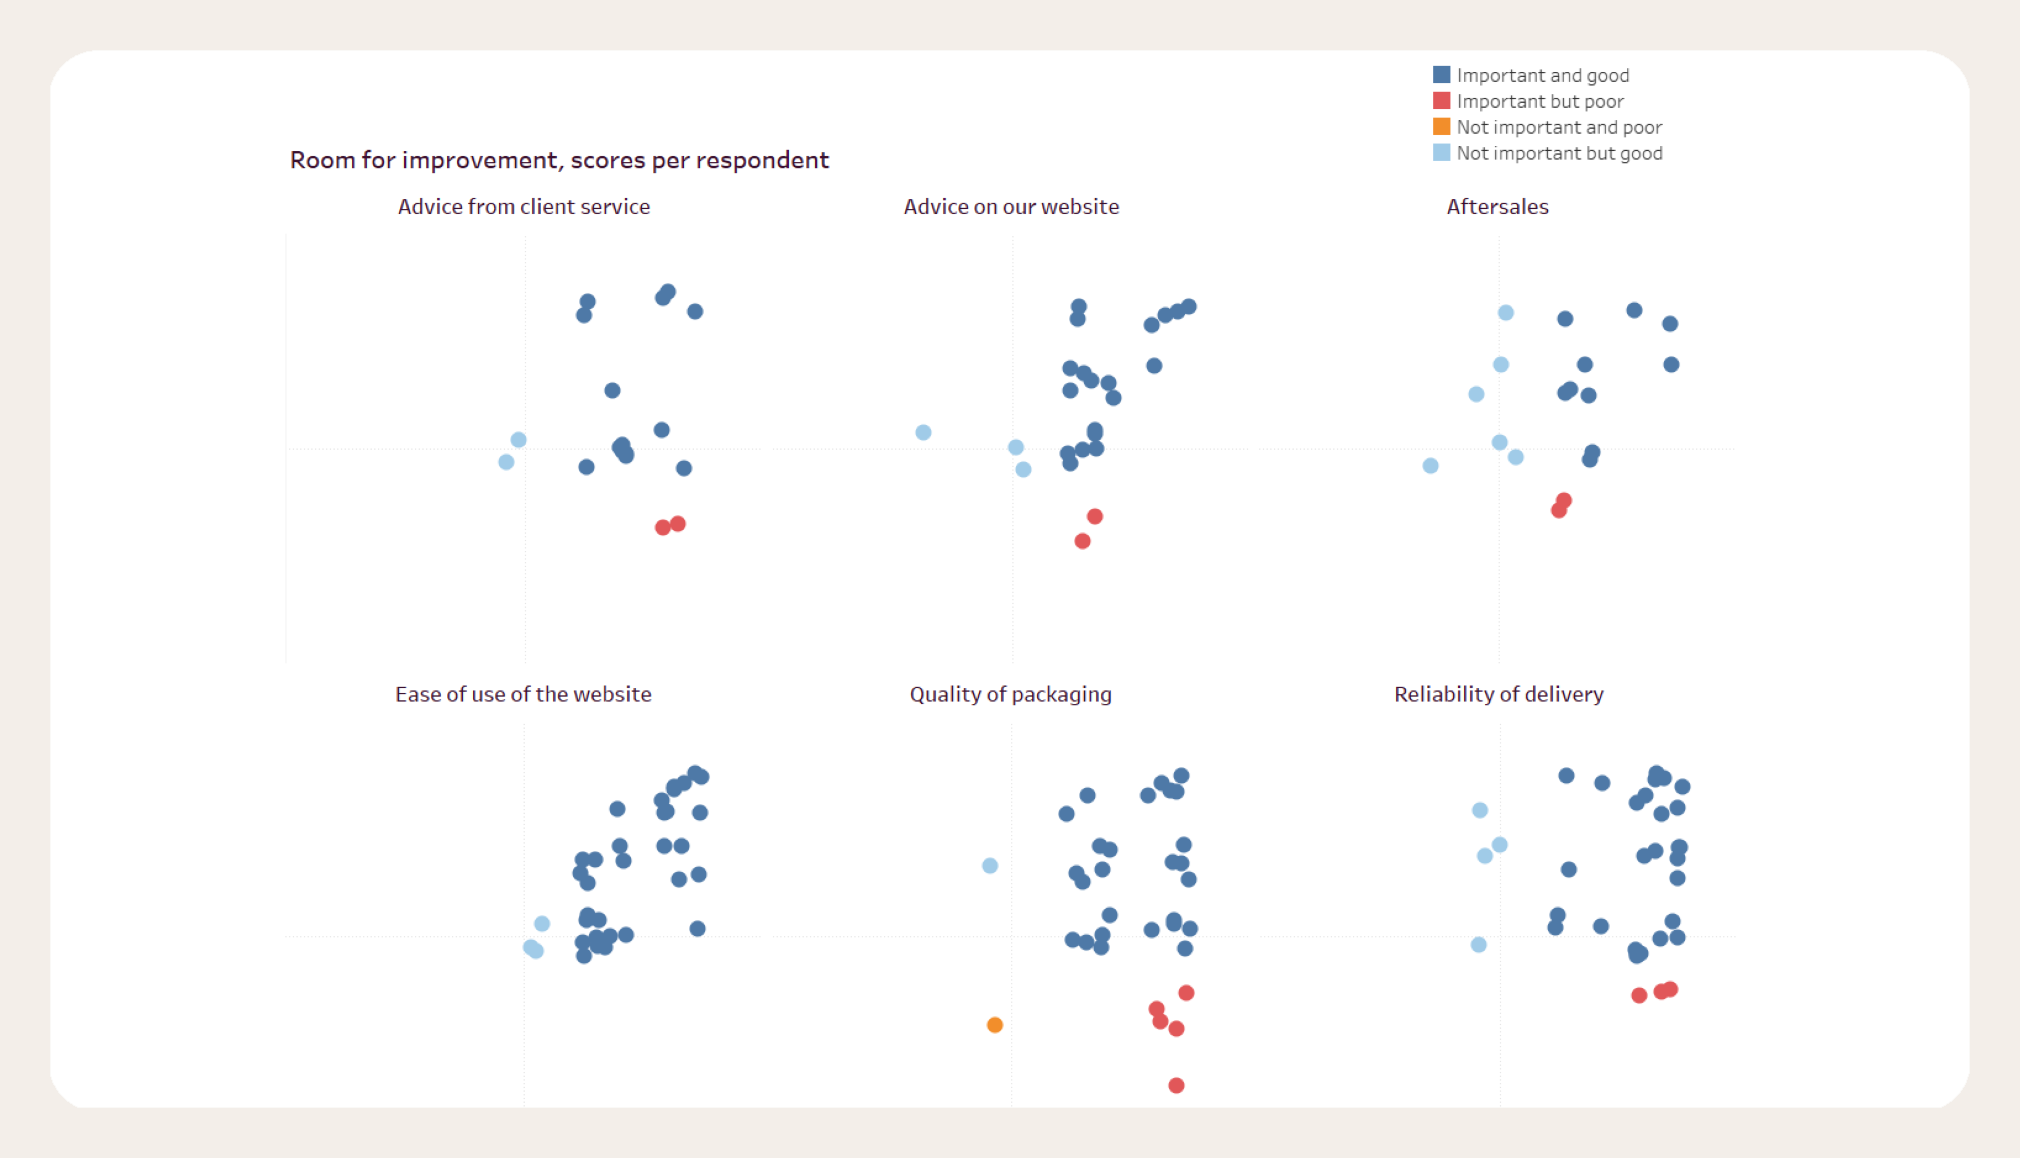
In this dashboard, using fictional data, you can see what such a visualization might look like.
Of course, it’s possible to filter by specific groups within the respondents. The tool tip also provides a wealth of additional information about the answers.
The dashboard can be delivered as a file for Tableau Reader. With this free software, you can share the dashboard within your organization, and it is not published online anywhere.
It is even possible to refresh the dashboard when new survey data comes in.
>> Click here for the live dashboard